We pay hundreds of millions in claims costs to thousands of injured people each year. This creates significant amounts of data. We use this data to analyse claims trends to help set insurance premiums for future years.
To help people identify the cause and cost of crashes and workplace injuries, and hopefully prevent these, we publish a range of statistics on our activities. If you are looking for information that is not found here, please let us know.
Motor Vehicle Statistics
Crashes
+-Number of crashes reported by location
- 2024 (up to 29 February 2024)
- 2023
- 2022
- 2021
- 2020
- 2019
- 2018
- 2017
- 2016
- 2015
- 2014
- 2013
- 2012
- 2011
- 2010
- 2009
- 2008
- 2007
- 2006
+-Number of crashes reported by time of day
- 2024 (up to 29 February 2024)
- 2023
- 2022
- 2021
- 2020
- 2019
- 2018
- 2017
- 2016
- 2015
- 2014
- 2013
- 2012
- 2011
- 2010
- 2009
- 2008
- 2007
- 2006
Number of Personal Injury Claims Received (up to 29/02/2024)
Number of Crashes Attended by an Ambulance (up to 29/02/2024)
Number of Crash-Related Hospital Bed Days (up to 29/02/2024)
Number of Crash-Related Fatalities (up to 29/02/2024)
Gender of Liable Person in a Crash (up to 29/02/2024)
Age of Liable Person in a Crash (up to 29/02/2024)
Costs
Crash-Related Costs (up to 29/02/2024)
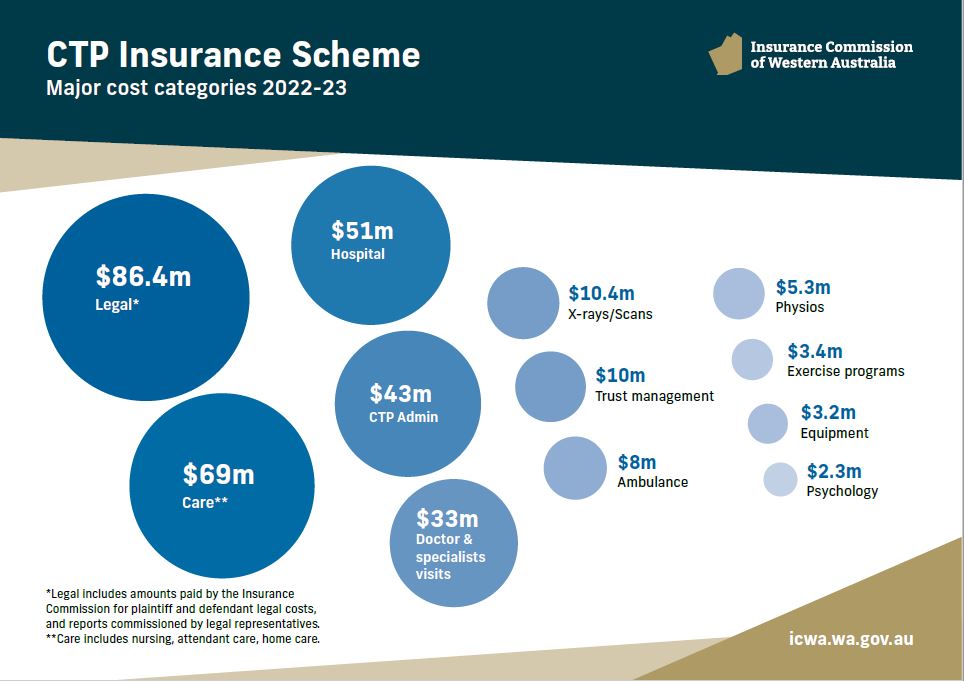
Diagram: Major cost categories within the CTP scheme (to 30 June 2023)
Media contact
Amber Blake
A/g Senior Communications Officer
+61 8 9264 3227
amber.blake@icwa.wa.gov.au


